by Jaimy Fischer
Studies on bicycling safety have typically relied on data generated through traditional reporting systems such as police and insurance reports. These data are lacking important details that would allow for more robust studies on bicycling safety. Even more important, 70-80% of bicycling incidents are not recorded(1), either because police/insurance are not initiated, the incident was a near miss, or because the incident was bicyclist-only and did not involve a motor vehicle.
BikeMappers know that we collect quite a few variables on the incident details, some of them mandatory and others voluntary. But what do we do with all of them?
All the variables that we collect are designed to support better research on the circumstances that lead bicycling risk and injury.
Below is a sample of some of the variables that we collect.
| Crash or near miss details |
Conditions |
Personal details |
| When was the incident? |
What were the road conditions? |
What is your year and month of birth? |
| Select date and time |
Dry |
Select year and month |
| What type of incident was it? |
Wet |
No response |
| Collision with stationary object or vehicle |
Loose sand, gravel, or dirt |
Please select your sex |
| Collision with moving object or vehicle |
Icy |
Male |
| Near collision with stationary object or vehicle |
Snowy |
Female |
| Near collision with moving object or vehicle |
I don’t remember |
No response |
| Lost control and fell |
No response |
Other |
| What sort of object did you collide with? |
How were the sightlines? |
Do you bike at least once a week? |
So how can we use BikeMaps.org data to evaluate injury and safety?
One thing we can do is take variables collected through BikeMaps.org reports and use them in predictive modelling. Recently we used a random forest classifier to model predictors of injury in Victoria, BC, Canada.
What is a random forest classifier?
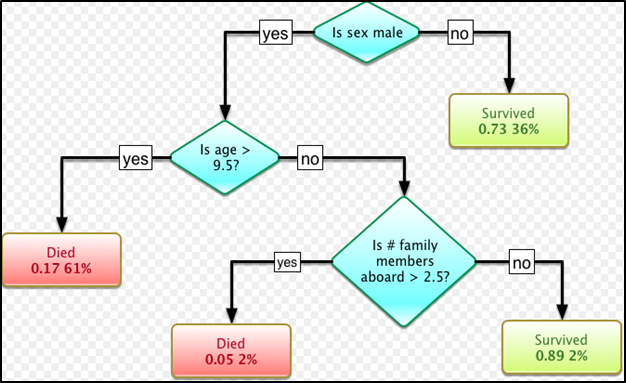
A random forest classifier is an extension of decision tree learning. A decision tree looks like a flow chart, where each internal node is a test on a variable, aka predictor, and each branch represents the outcome of the respective test. Each leaf (terminal node) is a class label, or decision. Shown below, as a predictor drops down the tree it is grouped into smaller and smaller datasets based on its level (for example yes or no). The end result illustrates how predictors are related to an outcome, and the tree splits demonstrate the best partitions of the data.
In the simple example below that uses a dataset on the Titanic, passenger survival is the outcome that is modelled. The blue diamonds are internal nodes that represent a predictor test, and the branches are the data splits. The leaves (terminal nodes) are the decision, in this example, whether the person survived or died when Titanic sunk.
A random forest classifier uses an average of a collection of many decisions trees in its final decisions. Instead of relying on a single decision tree, in a random forest you can grow, say, 1000 trees (a forest!). In each tree of a random forest, only a random sample of predictors and their levels are used to model the outcome (i.e. 10%). In a forest of 1000 trees, the random sampling process is repeated 1000 times, creating 1000 individual decision trees, and in the end, all of the trees “vote” on the top predictors of an outcome. Once the forest is grown, you can then look at the relationship between the predictors and the outcome.
We used a dataset of 111 collisions and 234 near misses for Victoria. This dataset contained 23 predictors, and each predictor had multiple levels. We modeled for the outcome of injury based on the predictors below.
Note: Our dataset was not quite large enough to break down injury into specific categories as collected in BikeMaps.org reports, instead, we grouped data into a simple injury/no injury outcome. In the future, we might have enough data to model injury severity, that is, what are the predictors that would require a hospital emergency visit or stay vs a doctor vs no treatment.
| Predictor |
Mandatory (m) or voluntary (v) |
Predictor levels |
| BikeMaps.org incident details |
|
|
| Were you injured (outcome) |
m |
Yes | no |
| What sort of object did you collide or nearly collide with? |
m |
Vehicle | person | infrastructure | other |
| What was the purpose of your trip? |
v |
Commute | exercise or recreation | personal business | social reason |
| BikeMaps.org incident conditions |
|
|
| What were the road conditions? |
v |
Dry | wet | loose sand or gravel | icy | snowy | don’t remember |
| How were the sightlines? |
v |
No obstructions | view obstructed | glare or reflection | obstruction on road | don’t remember |
| *Were there cars parked on the roadside? |
v |
Yes | no |
| *Where were you riding your bike? |
v |
Street with no bicycle facility | on a local street bikeway (bike route) | on a painted bicycle lane | on a cycle track | on a multi-use path |
| *What was the terrain like? |
v |
Uphill | downhill | flat | don’t remember |
| How were you moving? |
v |
Heading straight | turning left | turning right | don’t remember |
| BikeMaps.org incident personal details |
|
|
| Please select your sex |
v |
Male | female | other |
| Do you bike at least once per week? |
v |
Yes | no | don’t know |
| Were you wearing a helmet? |
v |
Yes | no | don’t know |
| Additional predictors collected via BikeMaps.org, not submitted by citizen mappers |
|
|
| **Precipitation |
-- |
Rain | none |
| **Visibility |
-- |
Daytime | dawn/dusk | dark |
| Time of the incident |
-- |
AM peak | PM peak | off peak |
| Other predictors based on past research collected from additional sources |
|
|
| Road classification |
-- |
Arterial | collector | local | off-street path |
| Road width |
-- |
4-28 meters |
| Road speed |
-- |
20 km/hr| 30 km/hr| 40km/hr| 50 km/hr |
| Slope classification |
-- |
flat | > 1° (perceived slope) |
| Is the roadway a truck route? |
-- |
Yes |No |
| Did the incident occur at an intersection? |
-- |
Yes |No |
| Bicycle ridership |
-- |
High |Medium | Low |
*to ensure modelling was as accurate as possible, these answers verified with external datasets
** Precipitation is collected and applied to BikeMaps.org reports via a web scraping application. Snow, sleet etc. would be included had those conditions occurred in Victoria at the time of a given report.
Results
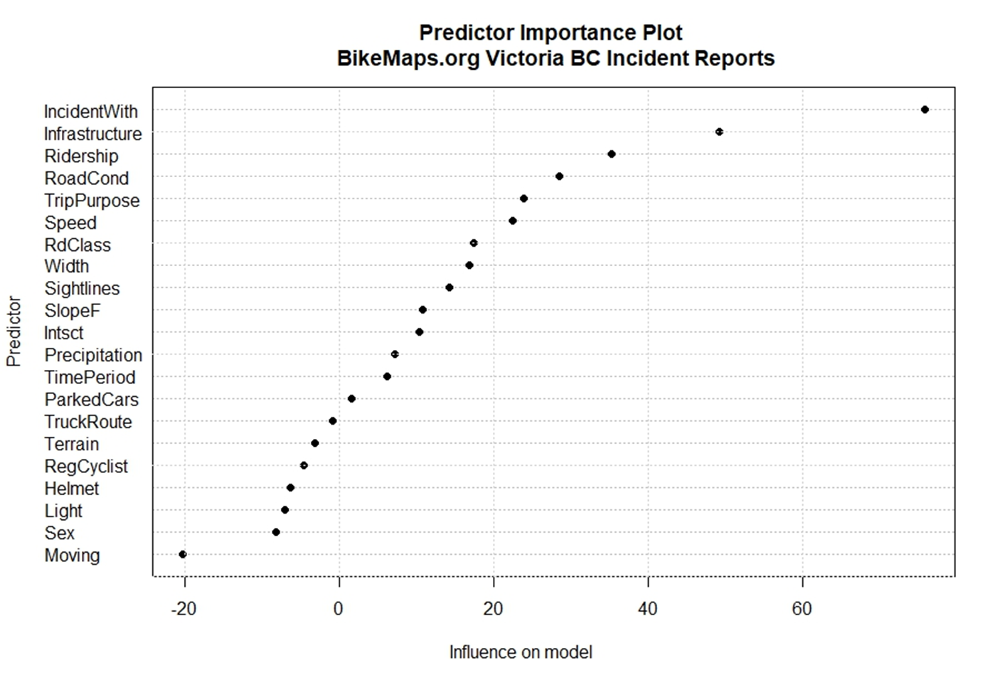
In order, the top 5 predictors of injury were:
- What object the incident occurred with (What object did you collide with?)
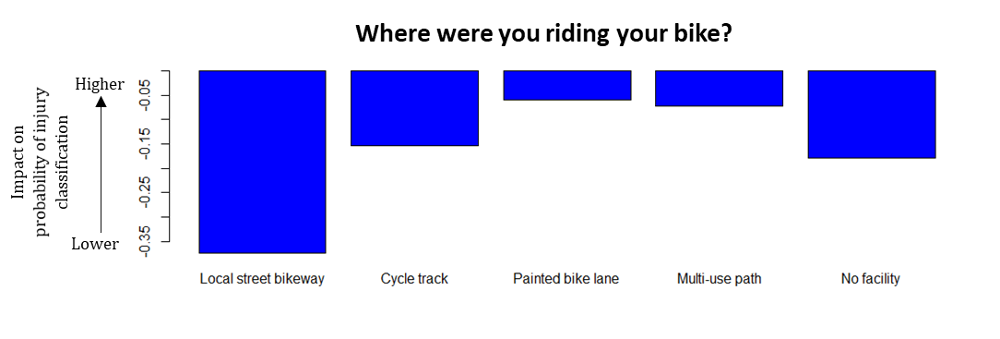
- The bicycling infrastructure present (Where were you riding your bike?)
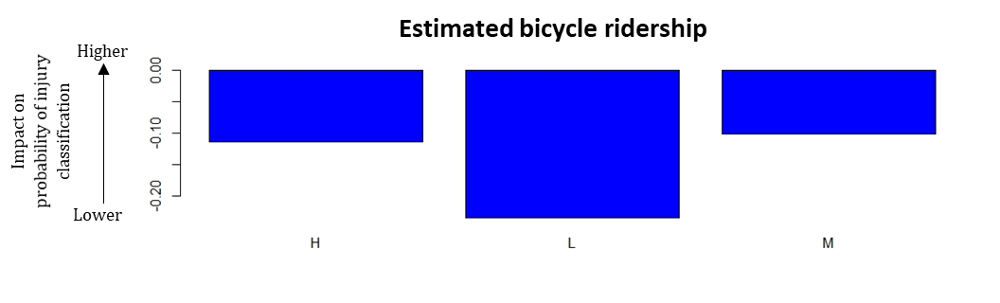
- Ridership at crash site
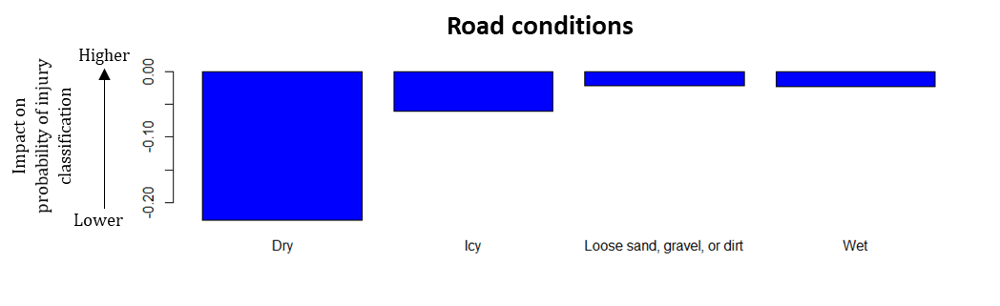
- Road conditions
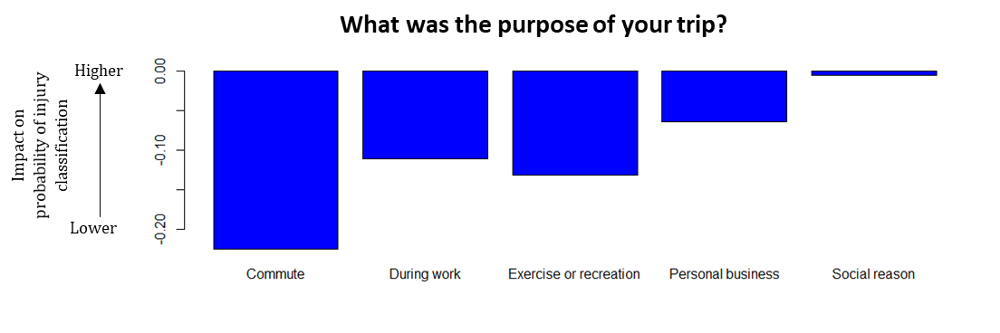
- Trip Purpose
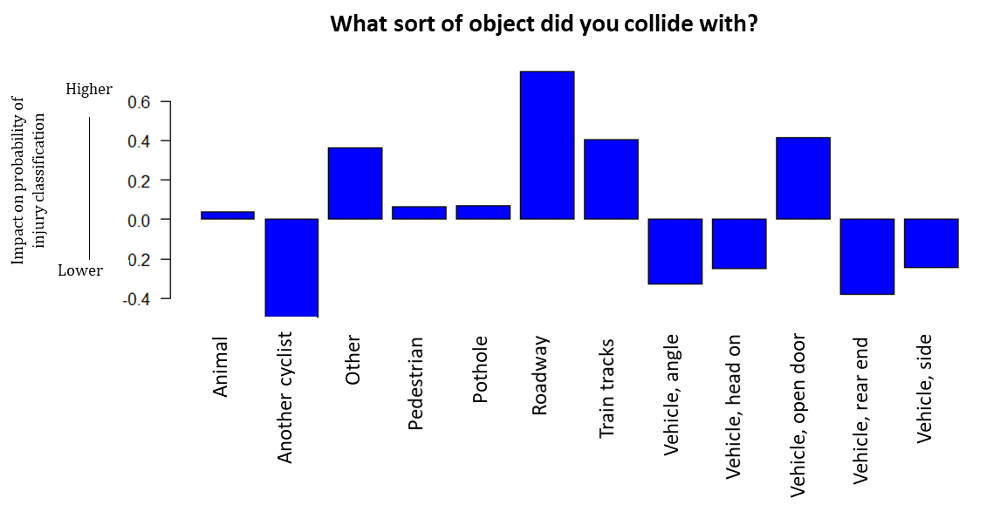
Below are partial dependence plots, which are an output from the random forest model. These plots are good for visualizing how each predictor and its different levels influence the outcome we are predicting with a random forest classifier. The plots are read as the increasing or decreasing probability of a classification with respect to the different values of a given predictor variable while holding all other predictors constant. For example, below depicts the predictor “What sort of object did you collide with?”, and the classification we are interested in is injury. You can see that, according to our model, collisions with the roadway, train tracks, and a vehicle open door have a higher likelihood of an injury classification.
1) Overall, the strongest predictors of injury were bicyclist-only crashes (including falls), and doorings. Collisions with infrastructure such as the roadway (i.e. as a result of avoidance or slipping on the road surface), a pothole or train tracks are examples that were reported by citizen mappers. The “other” category refers to reports that involved an object not listed in the incident pull-down menu. For example, one report indicated that the bicyclist collided with an unusual hazard on the road.
2) Next in predicting injury was the type of bicycle facility that the person was riding on, where painted on-street bicycle lanes and multi-use paths had a higher influence on an injury classification. Research has shown that these types of infrastructure have higher risk than other types.(2)
3) Estimated ridership at crash site.
4) Road conditions.
5) Trip purpose.
Reflections
Bicyclist-only crashes often result in injury, but are rarely captured in traditional reports(1,5). Our analysis results echo past research using surveys, interviews, or hospital administrative data (all time-consuming methods), which identify road surface features and conditions along the route as risk factors in bicyclist-only crashes(2,5). Similarly, in crashes involving other road users, our results mirror research that demonstrates higher risk on infrastructure such as multi-use paths, painted bike lanes and major roads with parked cars compared to bicycle-specific infrastructure(2). Our results also highlight novel findings on the importance of specific trip characteristics such as trip purpose and sightlines.
The findings in this analysis ultimately show that citizen science data can be complementary to bicycling safety research: specifically, that BikeMaps.org reports have the potential to address gaps in safety data and provide more detailed information on the circumstances of bicyclist crashes.
We have provided another method for analyzing BikeMaps.org reports. We used a random forest classifier as a novel approach to predictive modelling on the growing BikeMaps.org dataset, and demonstrate how BikeMaps.org data can help to address gaps in traditional reporting. We can take a closer look at top predictors by applying spatial analysis techniques to identify where top predictors are clustered. For example, is a there a specific area where bicyclist-only crashes are occurring more frequently? Thus, we can investigate unique results for different study areas. Results can be used by advocates, researchers, planners and other local stakeholders who are working to improve bicycling safety and increase ridership.
We look forward to improved modelling opportunities as more incidents are mapped!
References
- Winters M, Branion-Calles M. Cycling safety: Quantifying the under reporting of cycling incidents in Vancouver, British Columbia. J Transp Heal. 2017;7:48-53. doi:10.1016/j.jth.2017.02.010.
- Teschke K, Harris MA, Reynolds CCO, et al. Route infrastructure and the risk of injuries to bicyclists: A case-crossover study. Am J Public Health. 2012;102(12):2336-2343. doi:10.2105/AJPH.2012.300762.
- Lusk AC, Furth PG, Morency P, Miranda-Moreno LF, Willett WC, Dennerlein JT. Risk of injury for bicycling on cycle tracks versus in the street. Inj Prev. 2011;17(2):131-135. doi:10.1136/ip.2010.028696.
- Lusk AC, Morency P, Miranda-Moreno LF, Willett WC, Dennerlein JT. Bicycle guidelines and crash rates on cycle tracks in the United States. Am J Public Health. 2013;103(7):1240-1248. doi:10.2105/AJPH.2012.301043.
- Lopez DS, Sunjaya DB, Chan S, Dobbins S, Dicker RA, Francisco S. Using trauma center data to identify missed bicycle injuries and their associated costs. J Trauma Acute Care Surg. 2012; Publish Ah(6):1602-1606. doi:10.1097/TA.0b013e318265fc04.
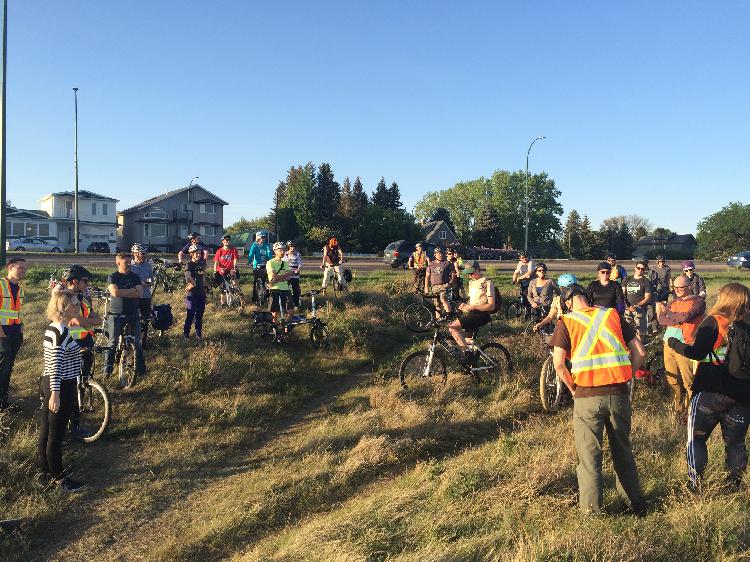 Jane's Ride 2016
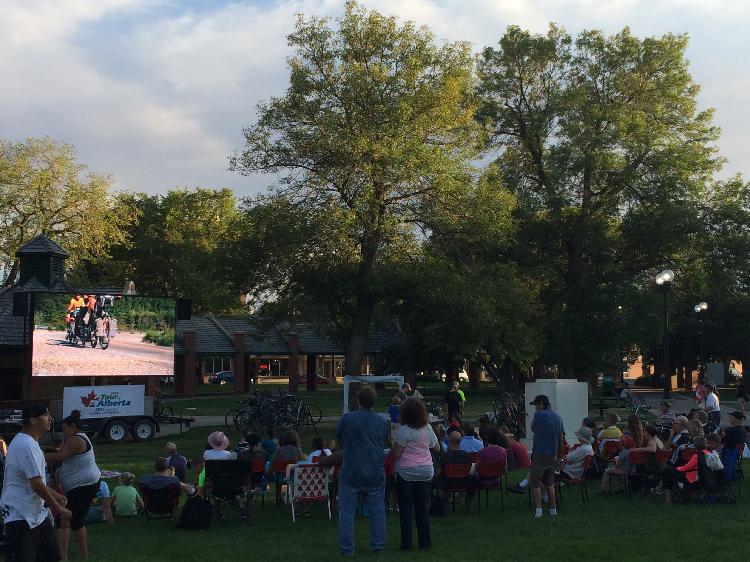 Bike in Film Night
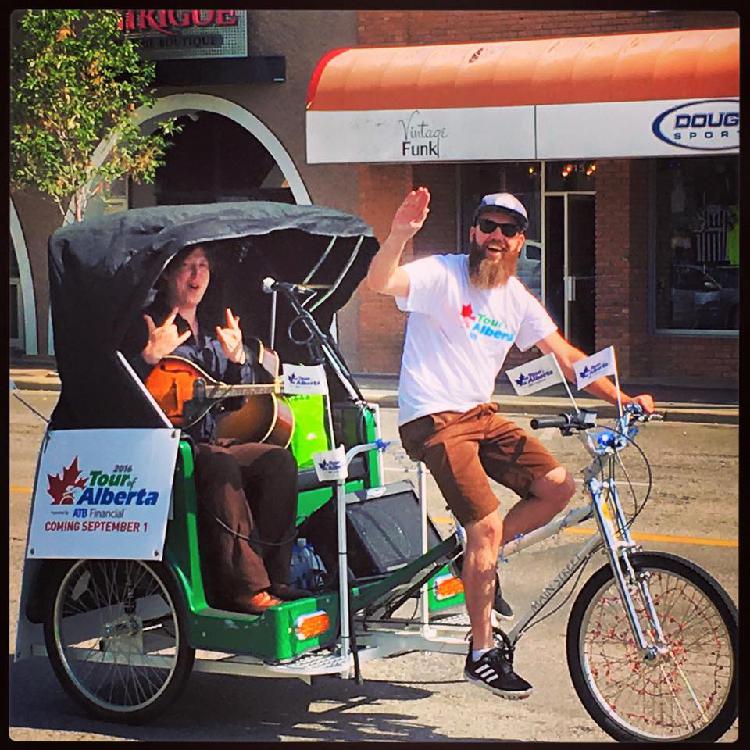 Bike Concert
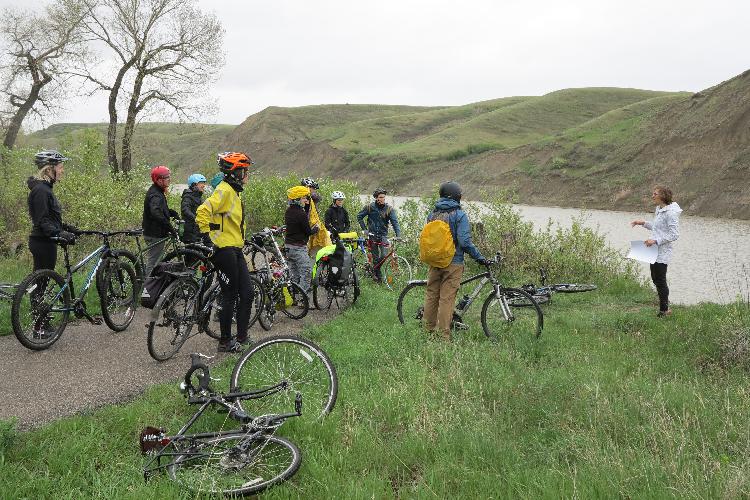 Second annual Jane's Ride (2017)